Sweet Insights
2021 State
of Treating
A tumultuous 2020 shook up the food retail space with the coronavirus in firm control of where and how people engaged with confectionery. The pandemic prompted many shopping changes, including fewer trips, larger baskets, store switching and record online shopping. Amid all the changes, confectionery remained a strong and important category, with annual sales of $36.7 billion across all channels.


2020 Category Sales Performance

$21.9B
Chocolate
Total Sales
+

$11.5B
Non-Chocolate
Total Sales
+

$3.9B
Gum & Mints
Total Sales
=

$36.7B
Confectionery
Total Sales

4.2%
Chocolate
2020 Sales Growth

2.9%
Non-Chocolate
2020 Sales Growth

Gum & mints had a tough year as consumers spent more time at home.
Sources: Euromonitor & NCA Projections (rounded)
IRI, MULO + C, 52 weeks ending 12/27/2020
Channel Choices

Grocery had strong gains for chocolate (+10.5%) and non-chocolate (+9.9%) alike.

Online confectionery sales skyrocketed (+76%).

Convenience had its strongest performance in non-chocolate (+4.4%).

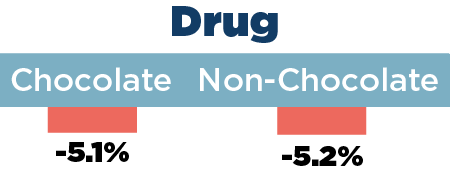
Drug had an off-year due to declines in household penetration and trips.
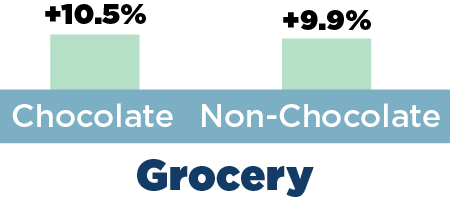
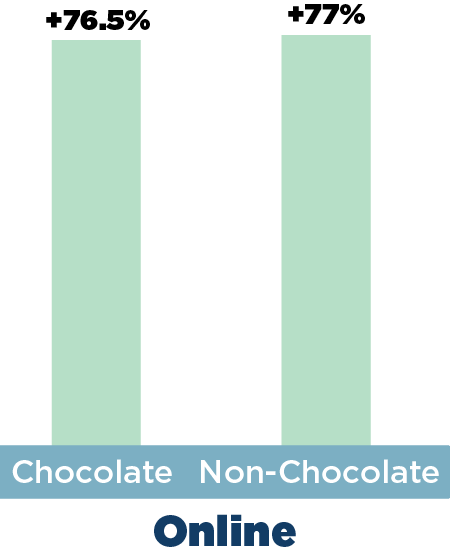
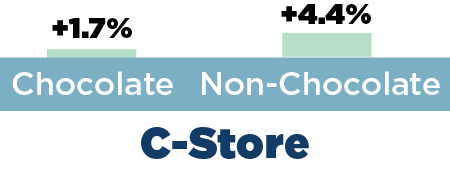
Source: IRI, 52 weeks ending 12/27/2020
Changes in Behavior
shoppers changed up their candy purchases in 2020:

Buying different pack sizes

Buying different brands

Buying other items or shopping at different stores
of Americans sent or dropped off confectionery gift baskets in lieu of visiting people during the pandemic.
Emotional Well-Being
of consumers feel physical health and emotional well-being are connected.
of consumers agree that it is completely fine to occasionally treat yourself with some chocolate or candy.
Parents and
Confectionery
parents discuss balance in everyday and seasonal candy consumption with their children.
of parents feel empowered to make informed choices.
parents monitor their children’s consumption.
of parents frequently purchase chocolate or candy at checkout.
Social Responsibility
and Sustainability
shoppers value environmental sustainability when making purchase decisions.
shoppers also like to buy from companies that give back to the community or charities.
Product claims that resonate with consumers include:

46%
All-Natural

38%
No Artificial Colors, Flavors, Sweeteners

28%
Non-GMO

28%
No High-Fructose Corn Syrup
Produced by:
 |
 |
Made possible by:

Methodology
This report is based on consumer studies by NCA and 210 Analytics conducted in September and December 2020 among 1,500+ qualified shoppers ages 18-75 in each study.
Data Overlay
The attitudinal survey data is complemented by retail measurement and household panel data provided by insights firm IRI for the 52 weeks ending December 27, 2020.
Unless otherwise attributed, data throughout this report are provided by NCA and 210 Analytics.

Get Your 2021 State of Treating Resources:
NCA President & CEO John Downs speaks at the 2021 State of the Industry Conference about the State of Treating.
