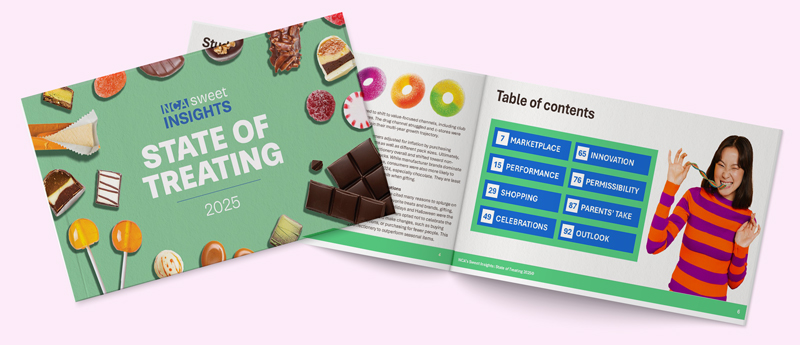

STATE OF
TREATING
2025
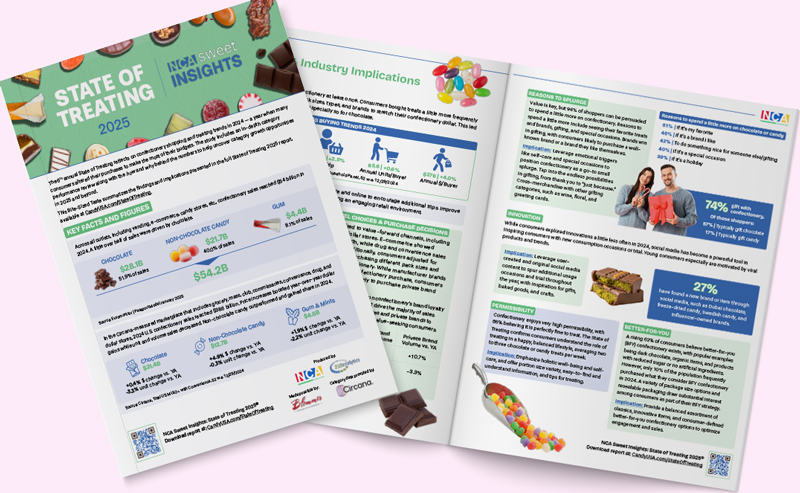
The 6th annual State of Treating reflects on confectionery shopping and treating trends in 2024 — a year when many consumers altered their purchases to make the most of their budgets. The study includes an in-depth category performance review along with the how and why behind the numbers to help uncover category growth opportunities in 2025 and beyond.

2024 Category Sales Performance
In all channels, both measured and unmeasured, confectionery sales were as follows:

$28.1B
Chocolate
Total Sales
+

$21.7B
Non-Chocolate Candy
Total Sales
+

$4.4B
Gum
Total Sales
=

$54.2B
Confectionery
Total Sales
Source: Euromonitor | Passport Model January 2025
In Circana-measured channels only, year-over-year growth for each category was as follows:

0.4%
Chocolate
2024 Dollar Sales Growth

4.9%
Non-Chocolate Candy
2024 Dollar Sales Growth

1.9%
Gum & Mints
2024 Dollar Sales Growth
Source: Circana, Total US, MULO+ with Convenience, 52 we. 12/29/2024
Life’s Occasions
Chocolate and candy have special roles during celebrations and holidays.
When buying seasonal treats, almost
consumers like seasonal treats to reflect the holiday’s shapes, colors, flavors, characters, and/or packaging
Total confectionery sales during the holidays are as follows:
 |
Valentine’s Day $5.5B | +3.8% |
 |
Easter $5.3B | +2.6% |  |
Halloween $7.4B | +2.2% |
 |
Winter Holidays $7.5B | +3.6% |
 |
Valentine’s Day $5.5B | +3.8% |
 |
Easter $5.3B | +2.6% |
 |
Halloween $7.4B | +2.2% |
 |
Winter Holidays $7.5B | +3.6% |
Source: Circana, Total U.S., MULO+ with convenience, 52 w.e. 12/29/2024
Valentine’s Day: 7 w.e. 2/18/2024 | Easter: 6 w.e. 3/31/2024 | Halloween: 8 w.e. 11/3/2024 | Winter Holidays: 8 w.e. 12/29/2024
Shopping Behaviors
Consumers’ focus on value led to a number of money-saving measures in 2024.
agree that chocolate and candy may be more expensive, but they are still affordable treats.
rank price as a top three purchase factor
of consumers like buy one get one promotions
made one or more changes to their confectionery purchases
Category Permissibility
Confectionery enjoys very high permissibility with consumers who understand the role of treating in a happy, balanced lifestyle. People in the U.S. enjoy chocolate and candy 2-3 times per week, averaging about 40 calories and one teaspoon of added sugar per day.*

85% of people believe that it is fine to occasionally have a piece of chocolate or candy.

A rising 62% believe that better-for-you confectionery exists.
*Source: The National Health and Nutrition Examination Survey (NHANES)
Social Media is Captivating Consumers
The younger the consumer, the more platforms are used. Nationwide and among candy consumers, Facebook remained the number one platform, but YouTube and TikTok are on the rise, driven by Gen Z and Millennials.
Have found a new brand or item through social media
Active social media users in the U.S.
Average daily time spent on social media in the U.S.
Source: Pew Research Center 2024
Active monthly usage among candy consumers:
Unchanged vs. 2022
YouTube
Up vs. 2022
Unchanged vs. 2022
TikTok
Up vs. 2022
Twitter/X
Unchanged vs. 2022
Snapchat
Down vs. 2022
Future Outlook
Financial recovery will likely lead to continued and renewed growth for confectionery.
Weighing market factors and interest in confectionery products, Euromonitor expects continued dollar growth over the next five years. The firm expects chocolate sales to rise by $10 billion to reach $38 billion. Non-chocolate candy is expected to keep growing its share of the total, reaching $27 billion. This includes mints. Gum sales are expected to reach $5 billion for a confectionery total of $70.4 billion.

$70.4B
projected U.S. confectionery sales by 2029
Source: Euromonitor International | Passport Model January 17, 2025
Get Your 2025 State of Treating Resources:
Methodology
Shopper data was collected using an online survey conducted between December 6 and 12, 2024, with a national sample of 1,551 consumers between the ages of 18 and 75. The margin of error associated with the survey is +/-2.5% at the 95% confidence level. Percentages may not always add to 100% due to rounding.
Produced by:
 |
 |
Made financially possible by:

Sales data provided by:

Looking for Historical Data?


